 |
|
 |
|
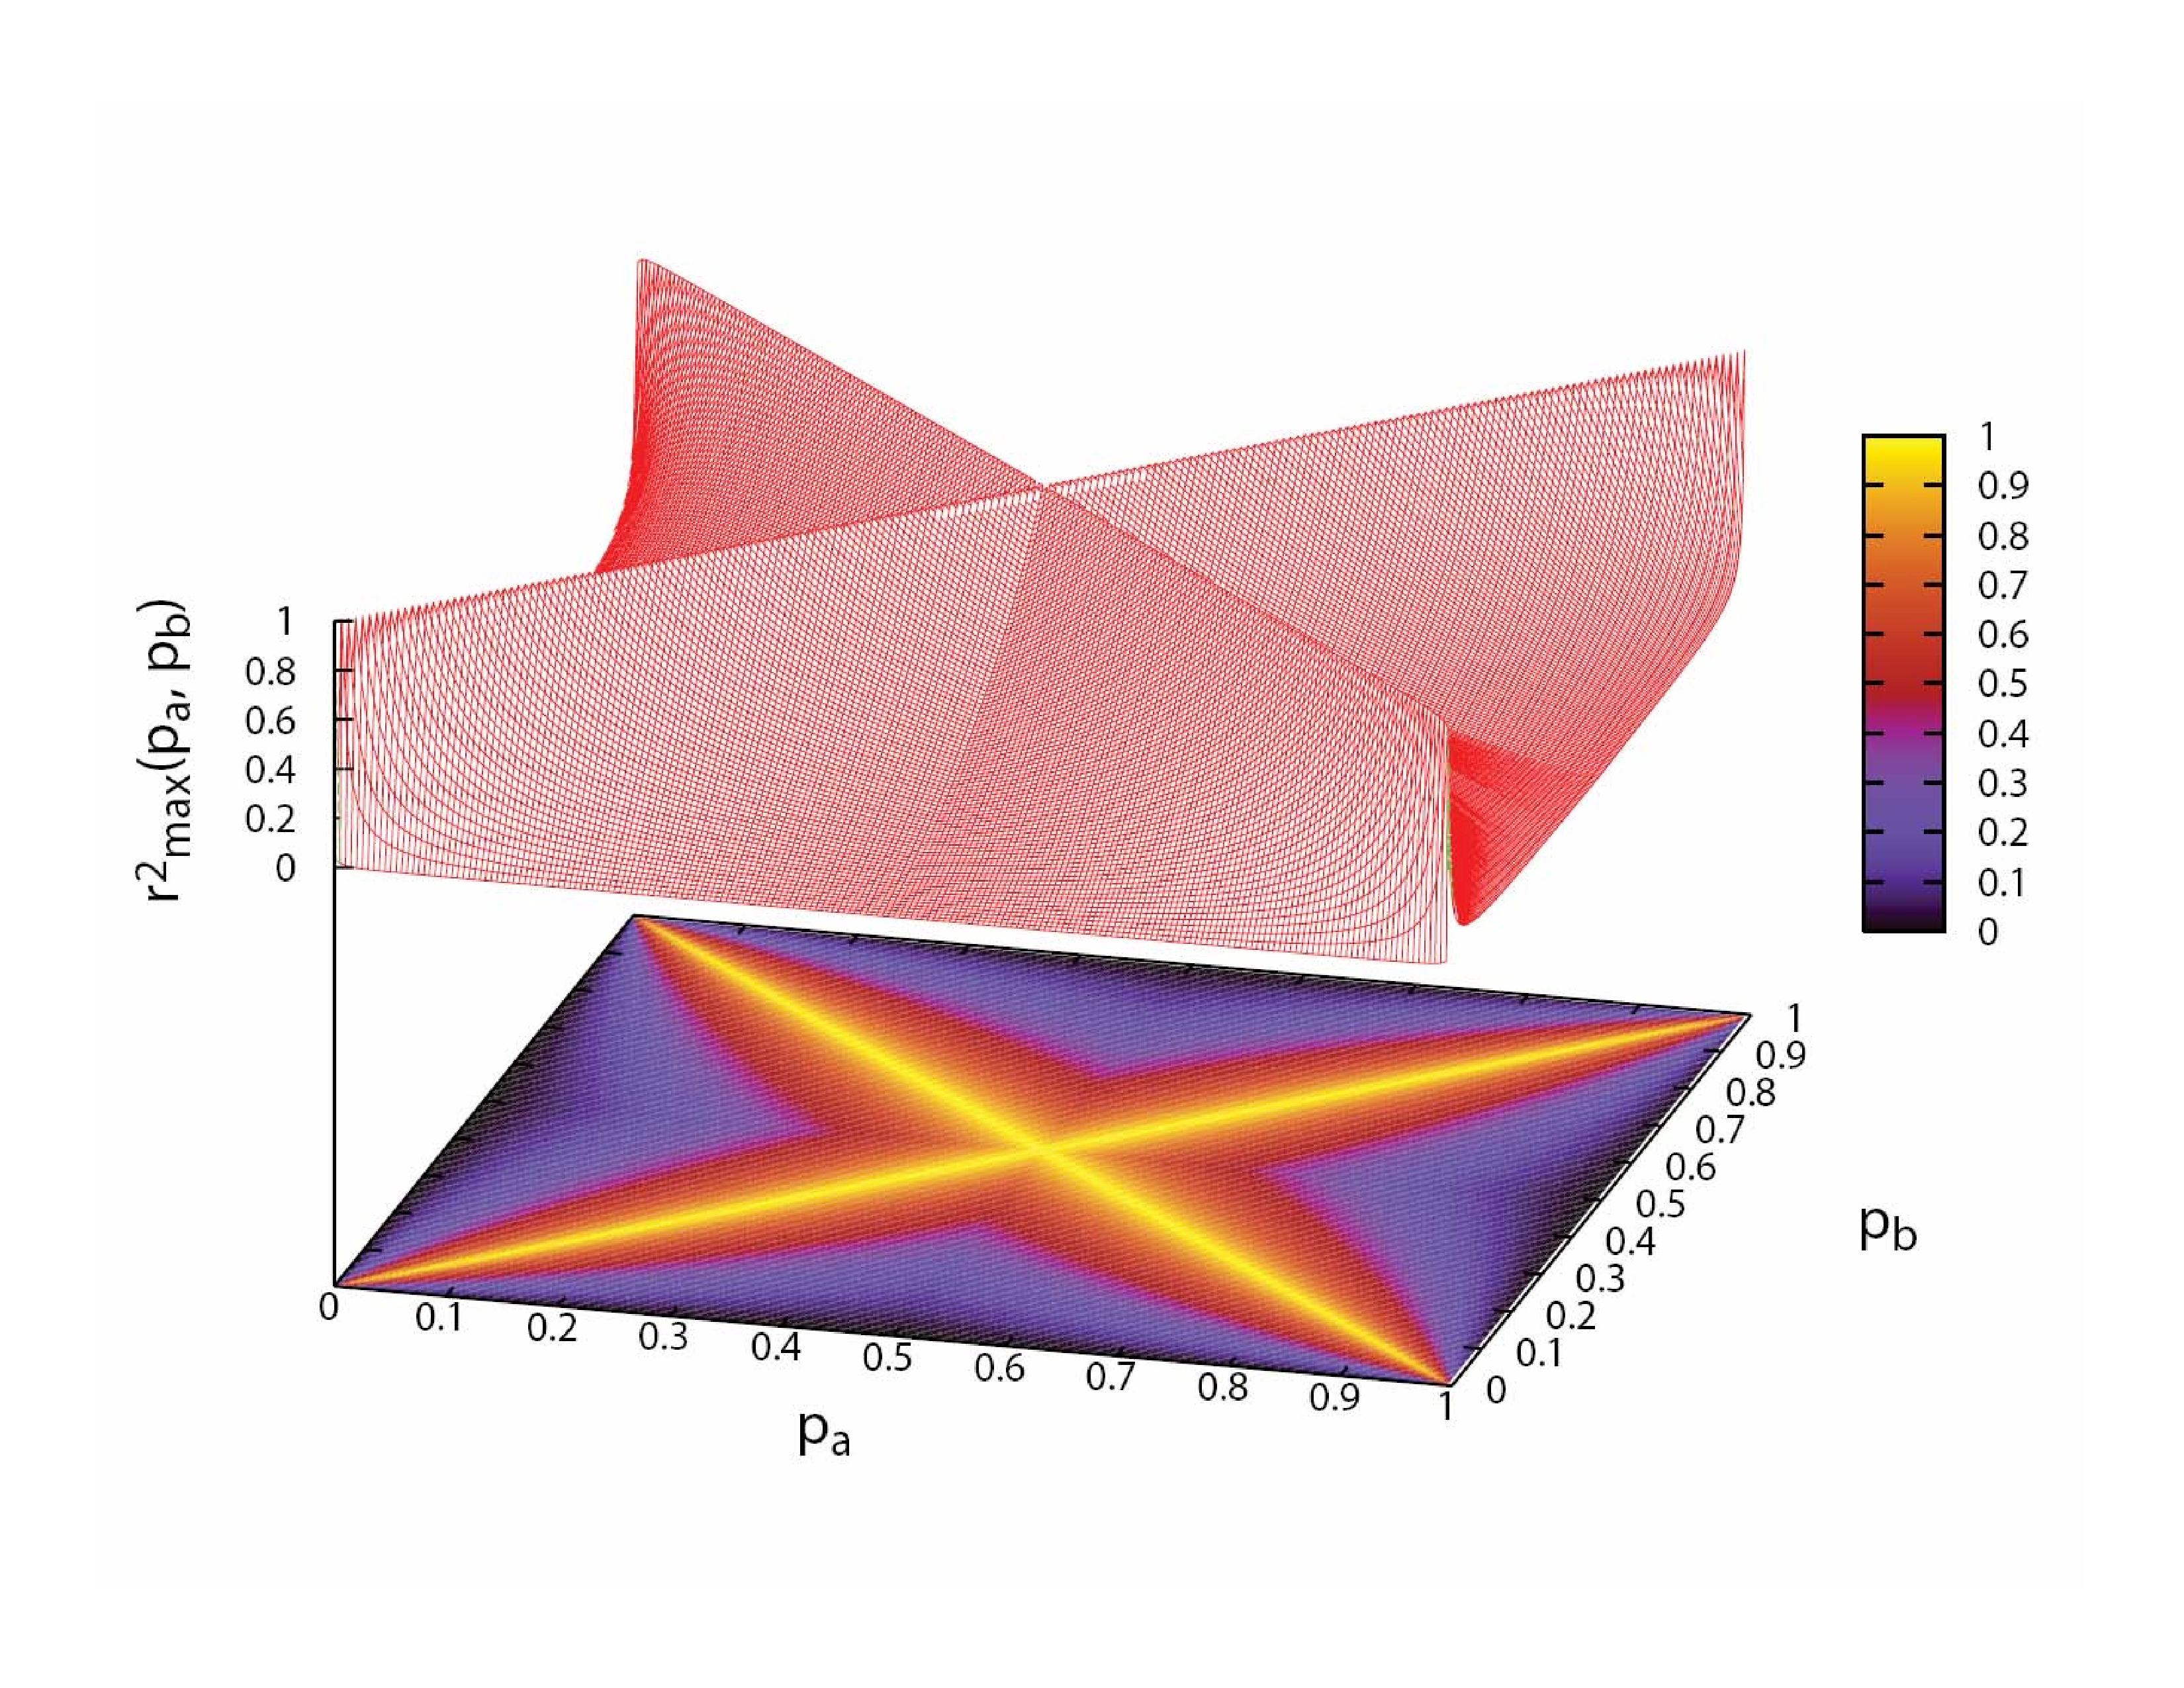
ABOUT THIS IMAGE. This image shows the maximal value of the r2 statistic for linkage disequilibrium as a function of allele frequencies at two biallelic loci.
The plot has symmetries corresponding to interchanging the alleles at a locus, or interchanging the two loci. The maximum drops quickly as frequencies at the two loci diverge from each other. The figure is taken from the work of VanLiere & Rosenberg (Mathematical properties of the r2 measure of linkage disequilibrium; Theoretical Population Biology 74: 130-137, 2008).