 |
|
|
 |
|
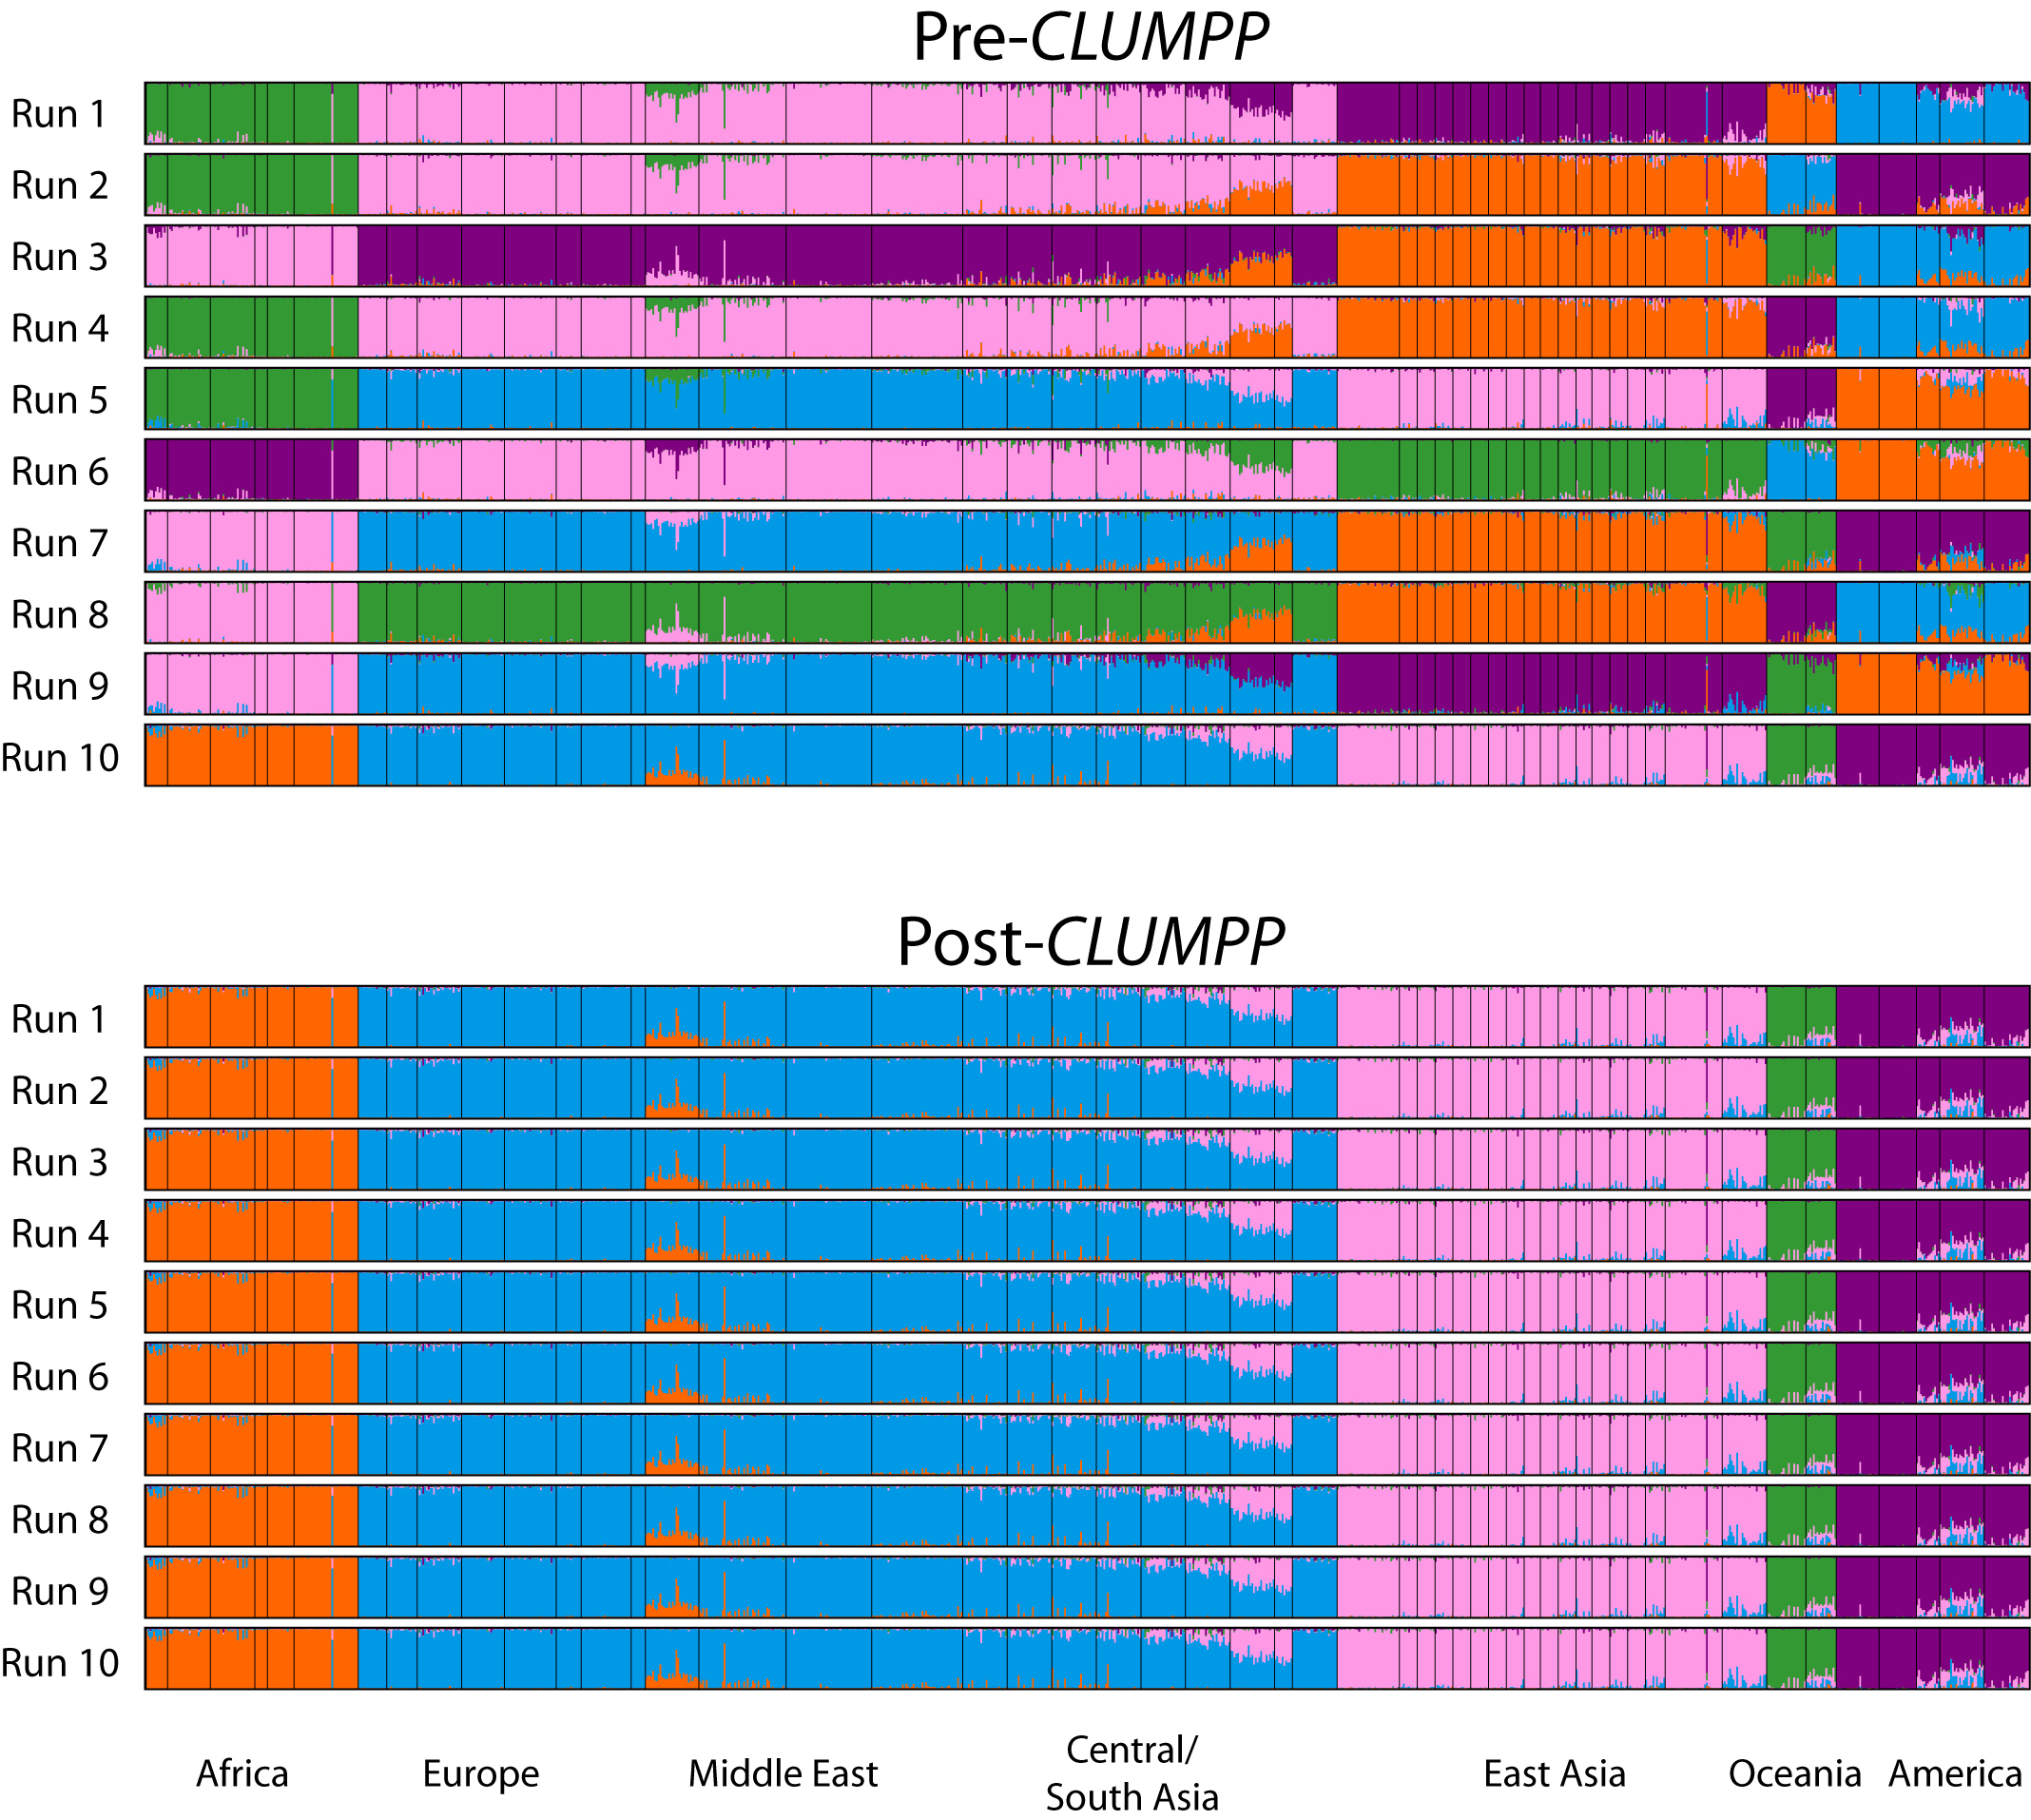
ABOUT THIS IMAGE. This image shows the CLUMPP aligment of multiple representations of human population structure.
Each color represents a cluster and each thin vertical line represents an individual partitioned across clusters. CLUMPP permutes cluster labels in order to optimize the similarity of the various clustering diagrams. The figure is based on the work of Jakobsson & Rosenberg (CLUMPP: a cluster matching and permutation program for dealing with label switching and multimodality in analysis of population structure; Bioinformatics 23: 1801-1806, 2007).
