distruct example
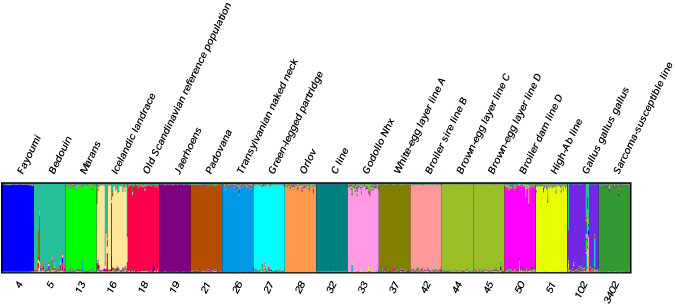
The figure shows a
distruct plot for a run of
structure using 600 chickens from 20 breeds. Each chicken is
represented by a vertical line, which is partitioned into 19 colors
that represent its estimated membership fractions in
K=19
clusters. Labels above the plot provide breed names; labels below the
plot are breed code numbers. Black vertical lines separate the
chickens of different breeds.
With the exception of the two brown-egg layer breeds (#44 and #45),
each breed essentially occupies its own cluster. Some chickens from
breeds #5, #16, and #102 do not cluster genetically with the other
individuals of their respective breeds. The plot is based on the run
of highest estimated probability among 100 runs discussed in Table 2
of Genetics 159: 699-713 (2001).
A different plot using the same data is shown in Figure 1 of Molecular Ecology Notes 1: 137-138
(2004).