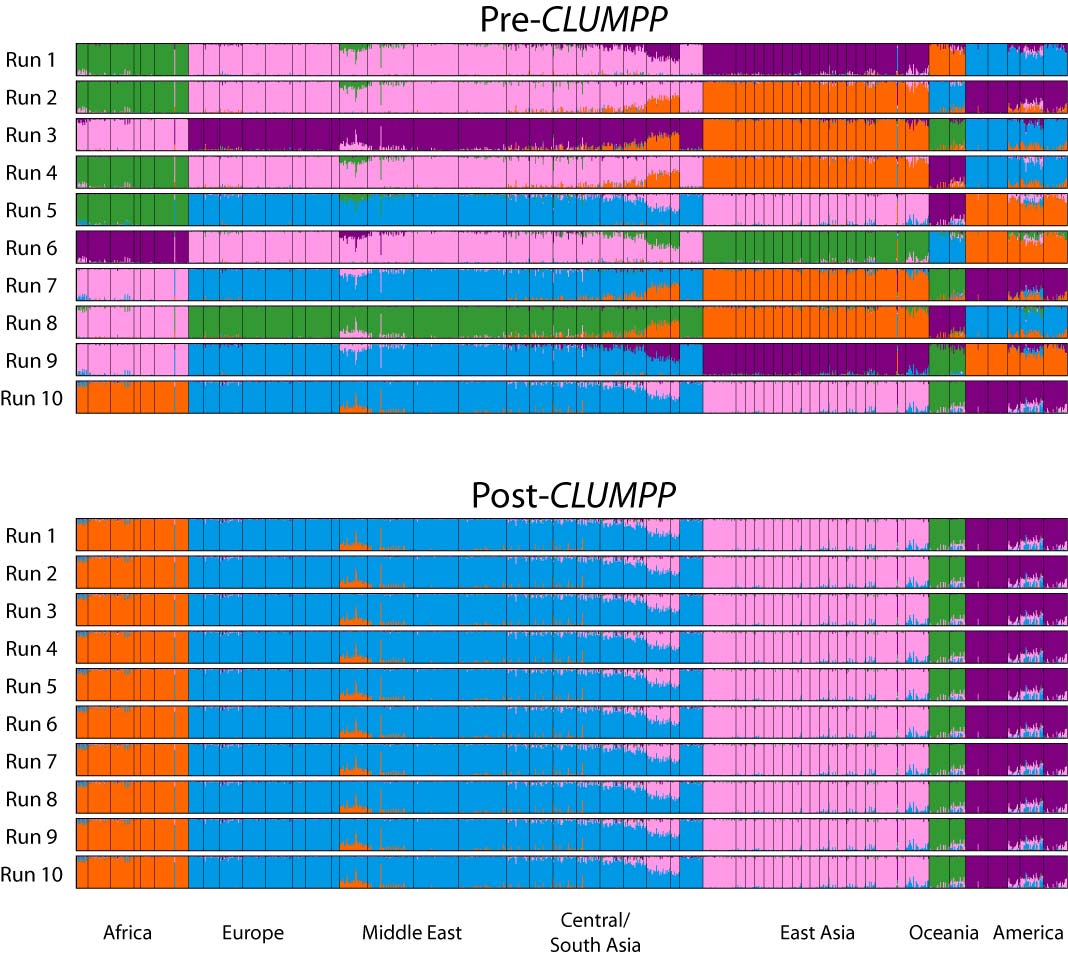
These graphs show the estimated population structure (plotted using distruct) for 10 runs of
structure using 1056 individuals from 52 human populations.
Each graph represents the output of one run of structure. In
each graph, each individual is represented by a vertical line, which
is partitioned into 5 colors that represent its estimated membership
fractions in K=5 clusters. Black vertical lines separate the
individuals from different populations. The 10 runs shown are the 10
runs with K=5 that are described in Figure 1 of Science 298: 2381-2385
(2002).
In the pre-CLUMPP figure, the distruct plots are made directly
from the structure output. In the post-CLUMPP figure, CLUMPP has been used to permute the 10
runs so that the clusters align across runs. To make the figure, the
Greedy algorithm of CLUMPP
was used with 10,000 random input orders of runs. The plot shown
represents the optimal alignment among the 10,000 input orders tested.
[High-resolution version of the CLUMPP example figure]