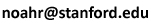
ABOUT THIS IMAGE. This image illustrates the strict upper bound
that exists on the value of
FST at a locus given the frequency of the most
frequent allele.
The y-axis represents FST, and the x-axis is the
frequency M of the most frequent allele. Both axes range from 0
to 1. The gray region represents the set of allowable values
of FST given M. The colored rectangles
represent counts of the number of microsatellite loci that have values of
(M, FST) in particular 0.01 x 0.01 regions,
for data on 101 Africans and 63 Native Americans. Darker points represent
larger numbers of loci. The figure is based on the work of Jakobsson,
Edge & Rosenberg (The
relationship between FST and the frequency of the most
frequent allele; Genetics 193: 515-528, 2013).
[Image gallery 1
| 2 | 3
| 4 |
5 | 6
| 7 |
8 | 9 | 10
]